 Home
Home20 Startup Metrics that Matter for Smarter, Faster SaaS Business Growth

Nine out of ten startups fail. One of the reasons may be the founders’ failure to focus on, or inability to interpret, the right metrics to measure product success. It’s nearly impossible to improve something without measuring it. As a result, the startup’s evolution is hindered; it can’t attract investors and goes out of business.
A metric is a quantifiable measure that lets businesspeople define the success of a product or activity and track changes. The key performance indicators (KPIs) are the most important metrics. It is fair to say that almost every successful product today is data-driven and determined by financial, marketing, and product performance metrics.
Startups typically follow a three-step goal-setting pattern. First, they have to design and build a useful, delightful, and competitive product, aiming primarily at customer satisfaction. When it is on the market, their focus shifts to acquiring customers and making a profit. This may be way harder now during the coronavirus recession, so we would like to focus on the essential growth metrics for startups, namely software-as-a-service (SaaS) companies, at the production stage.
Why SaaS Business Metrics Are Vital
The subscription-based SaaS business model is more complex than traditional businesses where most revenue is collected at the time of purchase. SaaS customers won’t pay upfront: small amounts of recurring revenues should come in over an extended period, the “customer lifetime.” Instead, all the investment is upfront. Before the company has a customer base, it needs to have built the product and spent some money to attract those customers. So, it risks running out of cash before it can secure steady cash flow.
Relying on future revenue, SaaS companies struggle to achieve predictable revenue growth. Simultaneously, they need to measure their growth against the proliferating growth-hungry competitors on the market with the potential of saturation.
Consequently, SaaS startups face particular difficulties related to marketing, sales, and customer success. They are often restricted by the amount they can spend on customer acquisition, while they need to segment and attract large numbers of quality leads and increase lead volumes in subsequent years. The sales team needs to close more deals faster, but the salaries of more experienced salespeople and investments in the team’s productivity extend the startup’s payback period. Customer success is another upfront expense for an already strained budget, but without it, customers that are not happy will be leaving quickly. The company will lose both the future profit and the money it had invested in acquiring those customers. Moreover, it has to retain customers long enough to earn back the investment and generate ROI.
What is SaaS metrics’ role in a startup’s quest for growth and success? Steering a startup without tracking the financial and customer success metrics is like steering a ship in the dark without any navigational instruments. The founders and CEOs need to understand and closely monitor them to make thoughtful, data-driven decisions.
In various sources, we have encountered over 60 indicators that may be applicable. The number may seem overwhelming, especially if you are a first-time startup founder. Many product managers do end up monitoring wrong metrics, or pick so many that monitoring them all becomes an impossible task. For this article, we have short-listed the principal metrics and KPIs that every SaaS startup should keep an eye on.
20 Key SaaS Metrics for Every Startup to Track
The key metrics for startups in the SaaS sector revolve around customer acquisition, customer retention, and finally, monetization.
Metrics that Help Measure User Engagement
SaaS companies should first focus on metrics that help understand users’ activities on their website or mobile app, how they sign up and churn, and other user engagement indicators.
1) Traffic-related metrics
This KPI mostly applies to websites and shows the total number of new people who visited the site. Organic traffic metrics pertain to visitors who found the webpage via search. Paid traffic counts those who arrived from paid sources: pay-per-click ads, social media ads, or sponsored content.

Reporting on unique visitors and traffic per channel should be part of any business’ routine, but SaaS companies should dive deeper. They mostly provide cloud-based solutions. To access them, customers need to log in, which means they need to revisit the website. Your overall traffic will grow as your user base grows. This can yield false data, showing higher traffic growth due to marketing initiatives.
Growing numbers of monthly visitors are evidence of effective top-of-funnel marketing, but it’s essential to know how active and interested they are. The average time that users spend on your site, how many pages they visit, and repeat visits, comments, downloads, and newsletter subscriptions indicate the quality of your traffic, e.g., the presence of sales-ready leads.
2) Activation rate
The activation rate is the number of users taking a specific action to get value from your product. Users experience the moment of activation when they first realize the product’s value for themselves. It often takes user interviews, nuanced user journey mapping, and behavioral analytics to discover which in-product actions correlate to long-term success. Once this critical moment in the user journey has been identified, the company can optimize the onboarding so that new users can faster see the value, activate, and begin adopting the product more deeply.
3) Lead-to-customer conversion rates
A conversion rate is a benchmark for how good your marketing and sales teams are at nurturing leads and turning them into paying customers. Depending on your processes, they may need to convert different types of leads:
- visitors who subscribed to your blog and newsletter
- visitors that filled out a form on your website to download an ebook
- marketing-qualified leads who meet the demographics and interest criteria
- sales-qualified leads that have demonstrated sales-readiness, usually by requesting a sales conversation or free demo
- product-qualified leads who are using parts of your product for free
The percentage of the latter category who become customers usually deserves the most attention.
4) Active users
Growing numbers of users or subscribers are good for reporting purposes, but they can’t reveal how engaged users are with your product, help you detect at-risk customers, or predict customer retention rates. What really matters is your active users.
As a best practice, users are considered ‘active’ when they complete valuable activities in your web or mobile app. They can be measured as daily active users (DAU), weekly active users (WAU), or monthly active users (MAU). For example, enterprise software companies are more interested in the weekly analysis.
When you divide the number of DAU by the number of MAU, you can find out how “sticky” your product is. If your SaaS is designed for daily use, this is an excellent metric to calculate. The stickiness rate allows for tracking the growth or decline of a product and helps in forecasting, budgeting, or deciding to develop new features.
5) Session-related metrics
The number of times a user opened your app, the average session duration, actions per session, time in-app, and intervals are additional success metrics for a product. They are easy to track but essential to the analysis of your users’ behavior.
The number of sessions can be measured per user or per cohort of users, e.g., customers on a particular subscription plan, within a week, month, quarter, or year. You can also compare this data within the groups of retained and churned users to forecast user behavior changes before churn and prevent it. When product managers spot long intervals between sessions, they may assume the users’ activities during that time and adapt some features correspondingly to motivate the users to decrease intervals and increase the users’ time in-app.
The analysis of the session length is the easiest way to track digital product usage. This KPI helps product managers understand the users’ needs, interests, and problems. For example, calculating the session duration of a group of churned users may give them clues on the reasons and how to improve user interaction. In-app time is a related metric, but it focuses on the number of hours users spend with your product per day, week, or month. It’s valuable for startups whose revenue directly depends on the time spent in-app.
6) Feature-related metrics
Feature prioritization, experimentation, and A/B testing (for example, with feature flags) are essential to successful product development and keeping the users happy. Tracking the users’ actions and which features they used helps understand the customer behavior and popularity of a feature since it was introduced and compared to a particular period. Analyzing this data for churned and retained customers will give you an idea of how your product keeps users interested and engaged. You can use this data in A/B testing to decide on features and UX/UI elements.
Customer Retention Metrics
The growth of a subscription-based SaaS business directly depends on minimizing the loss of customers. Retaining an existing customer and reselling or upselling to them is much cheaper and more valuable than bringing in a new customer. Monitoring and improving the retention-related SaaS KPIs can make a big difference to a business. These metrics help the founders and CEOs understand whether their marketing and customer support efforts pay off, improve the value delivered to the customers, keep them interested, and grow the revenue as a result.

1) Customer retention rate (CRR)
The retention rate is the proportion of customers who stayed with the company after a specific period. In the vast majority of cases, it is a major indicator of health in a software business. You can calculate your CRR monthly, quarterly, or otherwise, and decide what action is considered returning. Consider both the trend and the absolute value.
The customer renewal rate is a related metric. It evaluates the number of customers who renewed their subscription as a percentage of the customers who were “up for renewal.” This calculation of the retention rate is more accurate because it ignores irrelevant data on customers who are on long-term contracts or are not “up for renewal” during a specific period.
2) Customer churn rate
The opposite of retention is churn or customer attrition. Customer churn rate is one of the foremost metrics in tracking a startup’s day-to-day vitality. As a software business grows, churn becomes the determining factor for the maximum size it can reach.
The KPI measures the number of customers or accounts leaving the service within a specific time frame as a percentage of the overall customer count. It’s important to track both monthly and annual customer churn rates. SaaS customers typically repurchase every month, so companies build churn around that. If your customers purchase only 2-3 times per year, look at annual churn rates.
It is impossible to maintain a zero churn rate, even with an excellent product, but businesses should strive to keep the rate as low as possible.
User Satisfaction Metrics
Customers will be regularly paying your SaaS company as long as it continues providing value. If you do not ask how happy they are with your product, you might never know why they unsubscribe and you lose money.
1) Feedback as a metric
Honest, detailed direct feedback from people who are using your product regularly will help you improve it and understand whether the updates, enhancements, and pivots add value. This should help you retain existing customers. Feedback from customers who unsubscribed may help reduce future churn.
A SaaS company that wants to tap directly into the users’ minds may employ in-app questionnaires, customer feedback forms, and surveys, or allow users to vote for a particular feature on public resources. Customer ratings will help evaluate your support team’s effectiveness.
2) Customer satisfaction score (CSAT)
CSAT measures the overall level of a user’s content or discontent about individual interactions with your company, e.g., using a new product or service feature or conversation with customer support. Usually, users are asked to rank it on a scale of 1-3, 1-5, or 1-10. CSAT is calculated by dividing the total score by the number of respondents.
It’s useful to conduct the surveys at several points through the customer journey and before another subscription renewal – it gives you time to make improvements.
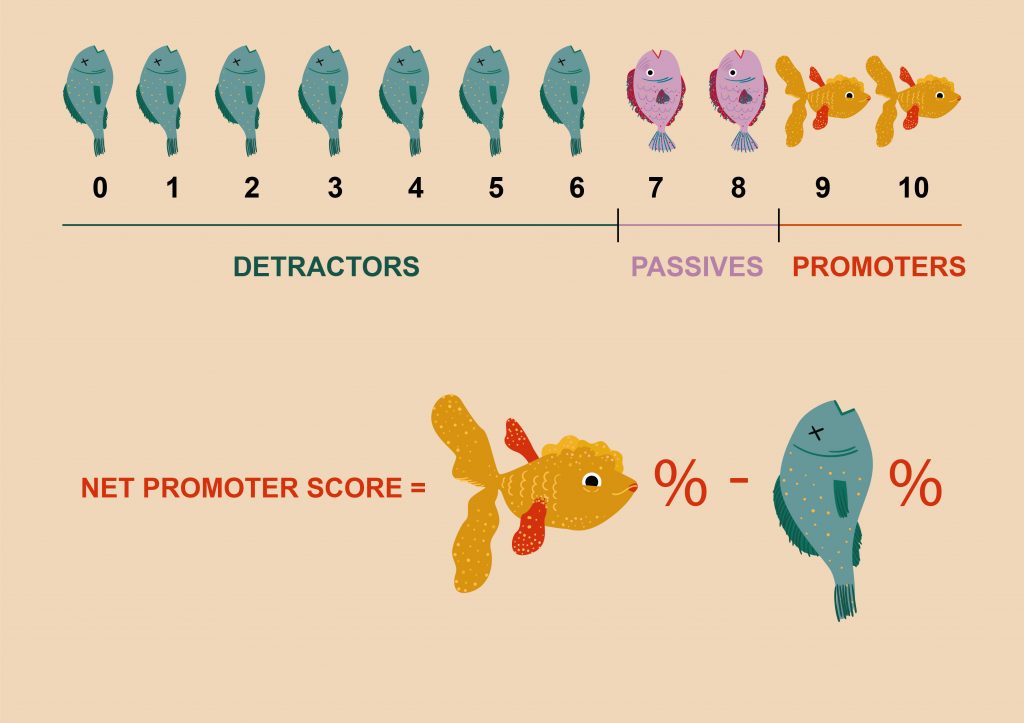
3) Net promoter score (NPS)
NPS is the most popular way to measure the level of customer satisfaction and loyalty. It measures the number of promoters – customers who are likely to recommend your product or company to others. Users are typically asked to estimate this likelihood from 0 to 10 and then classified according to the points they have given.
Measuring NPS is an easy way to learn why customers might be dissatisfied with your service and even dissuade others from using it. It’s smart to measure your NPS after product updates and have a few customers respond to in-app NPS surveys every day. You can follow up with the detractors to get to the root of their problems and use their feedback to enhance your product. The information learned about detractors should be shared across the company so that all departments can help improve the overall customer experience.
4) Viral coefficient
Word-of-mouth marketing is a significant factor in business growth: when existing customers assist in acquiring new ones, your growth can be exponential. The viral coefficient measures the growth of your customer base generated by successful referrals.
To measure virality, multiply the number of invitations the average customer sends by the conversion rate of invitations. A coefficient greater than 1 means that you gain an additional customer or more for every customer you acquire, but even a lower ratio is desirable.
5) Customer support-related KPIs
The number of support tickets created indicates the level of users’ discontent. A good practice is to tag tickets by types: bugs, feature requests, questions, complaints, suggestions, etc. The company then can quickly determine whether there’s a problem, usability issues, or customers want new capabilities. It should keep an eye on the average daily, weekly, and monthly numbers of tickets. In case of a ticket volume spike, product performance and quality should be reassessed promptly.
The first response time is the average amount of time it takes your customer support to respond to a case after it’s been filed by a customer. Shorter first response times directly correlate with customer satisfaction, but it’s more important to resolve issues quickly. There’s even a stronger link between the average resolution time and customer satisfaction and retention.

SaaS Financial Metrics
Once the startup has built a product and customers have adopted it, the goal is to generate revenue. At this stage, the following financial metrics define the fate of the product and the startup itself:
1) Monthly recurring revenue (MRR) and related SaaS KPIs
This is a measurement of how much revenue your customers generate in a single month; it does not include one-shot fees and special payments. The number should be tracked consistently, no matter how many pricing plans and billing cycles you have.
MRR is one of the major startup metrics for SaaS. It is essential for understanding your business’ growth, and with a good handle on customer acquisition and churn rates, you can even use it to predict future revenue.
The most straightforward way to calculate MRR is to summarize all the revenue you receive from your paying customers per month. Still, usually, SaaS companies need to calculate multiple MRR numbers, depending on the complexity of their businesses. To calculate net MRR, they should measure new MRR and churned MRR. If you have a pricing and packaging strategy to make additional profit from existing customers, you also need to calculate add-on MRR and factor it into net MRR:
- New MRR is revenue gained only from new customers in a given month
- Add-on MRR (or expansion MRR) – revenue from existing customers that buy additional product features, upgrade the account, add new users, etc.
- Churned MRR – the monthly revenue lost from cancellations and downgrades
The sum of these three metrics makes up your net MRR. If your churned MRR exceeds your new MRR, you risk going out of business fast. The MRR growth rate can show how quickly the company is growing.
Most enterprise SaaS companies and others with primarily yearly contracts, and some contracts for multiple years, should instead focus on the annual recurring revenue and the annual contract value that measure their customers’ value per year.
2) Average revenue per account (ARPA)
At the production stage, the startup’s goal is to increase the revenue it receives from customers. ARPA, also known as the average revenue per user/unit (ARPU), will tell you whether you are succeeding. If the business relies on monthly subscriptions, it usually calculates APRA per month, but every SaaS company can do it quarterly or yearly according to its plans and billing options.
A simple way to do it is to calculate the total MRR you have at the end of a period and divide it by the number of active accounts at that time. A good practice is to measure ARPA for new and existing customers separately to understand how your ARPA is evolving.
3) Revenue churn
Revenue churn or MRR churn rate measures the amount of revenue you lose due to customers leaving your service or downgrading subscriptions each month, as a percentage of overall revenue.
For most SaaS companies, revenue churn provides a better indicator of their health than customer churn, but it’s important to track both. In reality, the customer churn rate of 5% rarely results in a 5% revenue churn because some customers generate more revenue than others. They buy different pricing packages, and subscription prices usually vary depending on the number of seats, users a customer pays for, and storage. Successful upselling can lead to higher revenue even despite losing more customers than the previous month. This is called negative revenue churn.
4) Customer acquisition cost (CAC)
CAC is sometimes called the startup killer: many have failed to find a way to acquire customers at a low enough cost. The metric allows you to measure your ability to generate new revenue from sales and marketing expenditures. Understanding how much every customer acquisition costs and identifying the most profitable marketing and sales channels is key to scaling profitably.
CAC tells you exactly how much you need to spend to attract and acquire a single new paying customer. For most SaaS businesses, the amount is determined by:
- The costs of generating a lead, usually encompassing marketing expenses like advertising, search engine optimization (SEO), content writing, etc.
- If the company follows an inside, channel, or field sales model, the costs of converting that lead into a customer, typically the sales, or touch costs – the salaries and commissions of sales development reps or field salespeople.
Divide your total sales and marketing expenditure in a given period by the number of new customers acquired within that period. As a rule, CAC is calculated at the rate of a year.
A SaaS company should also track the cost per acquisition for individual marketing campaigns. If it generates leads from paid and unpaid channels, it’s important to calculate CAC separately. This way, it becomes clear which marketing is more cost-effective.
5) Months to recover CAC
For many SaaS companies in the early days, the cost of acquiring a customer often significantly exceeds the monthly revenue from that customer, while capital is expensive. Sometimes it takes even years to earn back that investment. It can be beneficial to work out how long this payback period will be. It’s a good predictor of how well a SaaS business will perform.
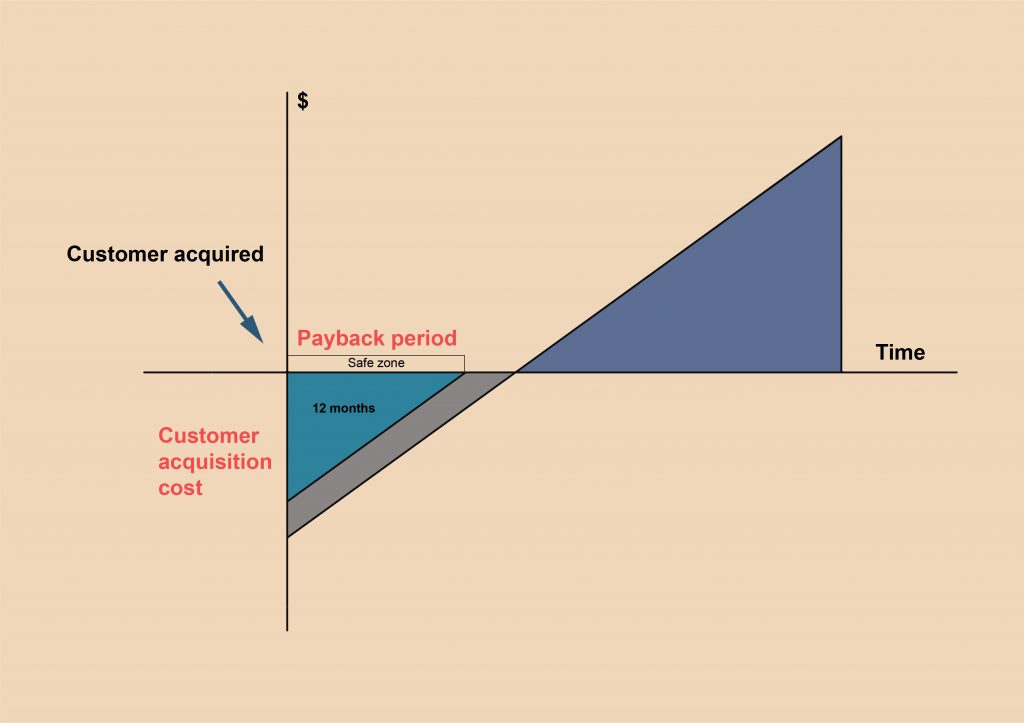
Months to recover CAC, or CAC payback period, helps determine how soon a customer starts generating ROI for your business. To calculate this metric, divide CAC by the MRR per customer. It’s desirable to recover your CAC in less than 12 months. Another version, the gross margin-adjusted CAC payback, multiplies the MRR in the formula by the business’s GM. This metric accounts for the velocity of customers being acquired, in addition to their profitability.
6) Customer lifetime value (CLV, LTV, or CLTV)
For the CAC metric to be truly meaningful, you need to cross-reference it with your customer lifetime value (CLV). It represents the average amount of revenue generated by a customer over the lifetime of their account. The longer customers keep using your SaaS products, the higher their CLV will be.
The simplest formula to calculate your CLV is ARPA divided by the customer churn rate. It can help you understand whether it’s time to reconsider your pricing and product marketing strategy, where your most valuable customers are, and much more.
7) CLV-to-CAC ratio
A SaaS company can stay profitable in the long run if its CLV is at least three times larger than its CAC. There’s a high chance that won’t happen for early-stage startups, but you don’t need to panic. It should take a while to cover the marketing, sales, and other expenses until your customers become profitable. Just keep a close eye on these metrics as your business matures and strive to keep your CAC below your CLV.
The Takeaway
In this article, we have described only twenty key SaaS metrics. You may wonder why the annual recurring revenue (ARR), gross margin, burn rate, and many other relevant indicators are missing. If you research further, you might discover dozens of additional metrics that matter for your business.
For your convenience, we have compiled a list of 60+ SaaS metrics in the Growth, Marketing, Sales, and Customer Success categories.

It’s recommended to select up to ten metrics, the combination of which gives a comprehensive view of your business performance, tune them according to your unique needs, and stick to them. Choosing your main KPIs…
- focus primarily on those that reflect user needs, user happiness, and engagement
- align the user, product, and business goals
- accentuate SaaS KPIs that impact long-term growth in revenue and avoid vanity metrics
Alternative-spaces recommends the following five startup growth metrics to get you started. MRR can be your SaaS company’s guiding star and its primary benchmark for progress. When it comes to measuring your business efficiency, we recommend tracking your gross margin-adjusted CAC payback. As for predictability, the key metrics to monitor are the customer renewal rate and the CLV-to-CAC ratio. Making small improvements to those numbers can dramatically improve the overall health of your business.
Three guidelines can help you judge quickly whether your SaaS business is viable:
- You should recover your CAC in less than 12 months.
- At least 30% of your revenue should come from upselling and cross-selling to existing customers in order to offset inevitable churn.
- Your CLV should be about three times your CAC. It is a good way to figure out whether you will be profitable in the long run.
The selected SaaS business metrics should be monitored and calculated regularly. Luckily, a plethora of services can do the job for you. The popular analytics tools out there include, but are not limited to:
- Adobe Analytics
- Amplitude (has a free plan)
- Baremetrics
- ChartMogul (has a free launch plan)
- Google Analytics (with a free starter plan)
- Mixpanel (has a free starter plan)
- Piwik PRO
- ProfitWell (free)
These instruments will help you consistently monitor and get the right calculations of the critical metrics to measure product success. Alternative-spaces can help you act on the results to accelerate your growth. For example, by enhancing the onboarding or building your SaaS landing-page with our UX/UI experts’ help, you can increase the activation rate and facilitate conversions from visitors to customers. A UX audit may provide actionable insights for improving the software’s usability and thus, your customer satisfaction and retention rates. Our Agile development process facilitates quick delivery of new features and updates, and outsourcing the programming will ease your startup’s budget burden.
Content created by our partner, Onix-systems.